London Liverpool Street becomes first British railway station to surpass 100 million entries and exits in a year, ORR stats show
19 November 2026
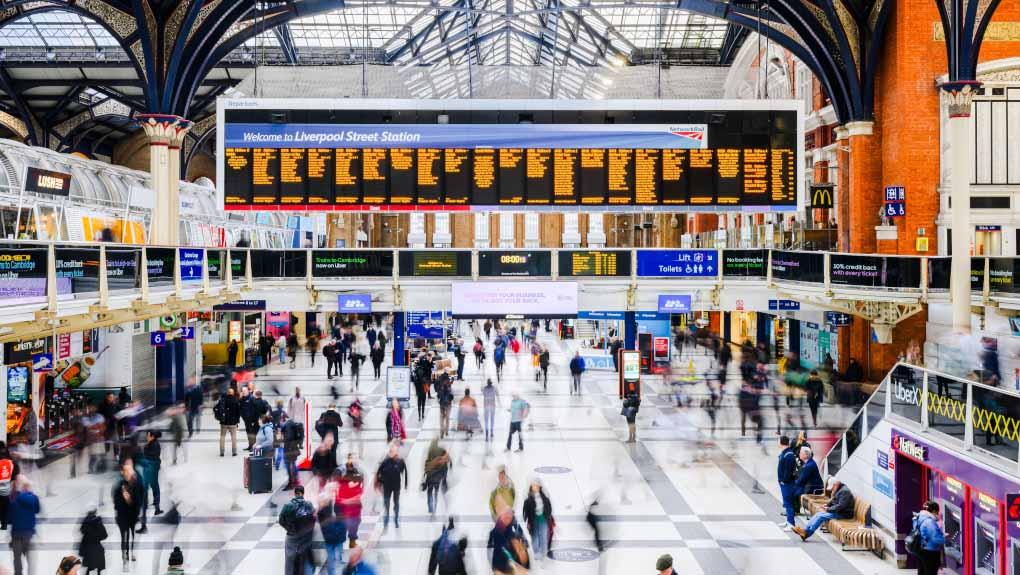
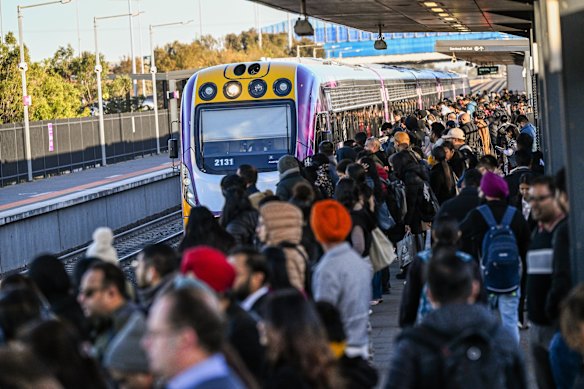
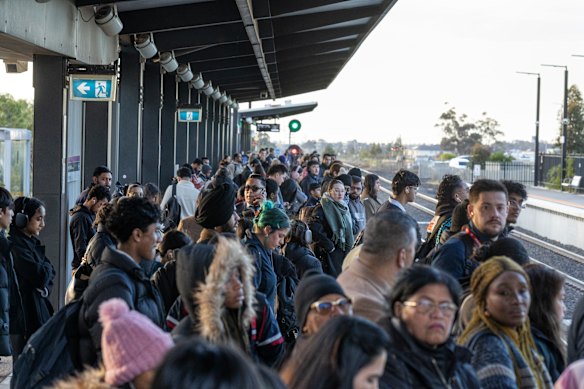
The station recorded an estimated 102.7 million entries and exits between April 2025 and March 2026, up from 98.0 million in the previous year to retain its position as Britain’s most used railway station for the fourth consecutive year.
Outside London, Birmingham New Street remained the most used station with 38.8 million entries and exits. Leeds overtook Manchester Piccadilly to become the second most used station outside London, with 28.0 million entries and exits compared with Manchester Piccadilly’s 26.6 million.
In Scotland, Glasgow Central remained the most used station with 25.1 million entries and exits, followed by Edinburgh Waverley with 23.9 million. Cardiff Central remained the most used station in Wales with 12.9 million.
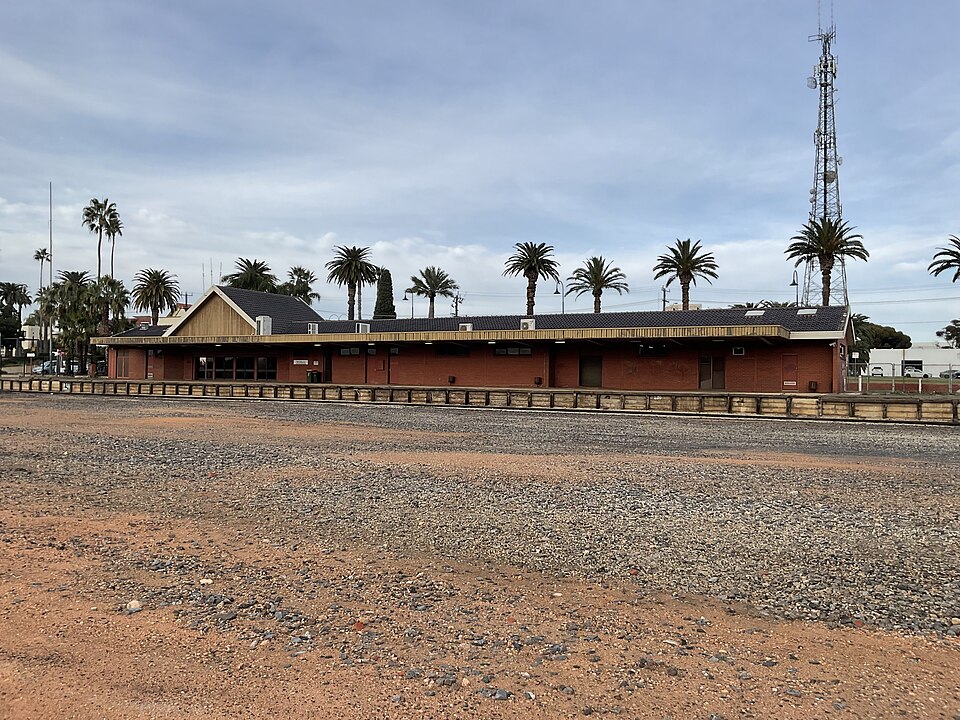
At the other end of the rankings, Reddish South in Greater Manchester was Britain’s least used station, recording just 94 entries and exits during the entire year.
The statistics also reveal Britain’s busiest journeys between stations. In the latest year, the busiest journey was between London Liverpool Street and Tottenham Court Road, with 8.2 million journeys. Six of the 10 busiest journeys were between stations only served by the Elizabeth line, highlighting its continued prominence in travel across London. Outside London, the journey between Birmingham New Street and Coventry was the busiest, with 2.5 million, followed by Edinburgh Waverley and Glasgow Queen Street with 2.3 million.
Graham Richards, ORR’s director of planning and performance, said:
The top 10 most used stations in Great Britain
| Rank | Station | Entries and exits | Rank last year |
|---|---|---|---|
|
1 |
London Liverpool Street |
102.7m |
1 |
|
2 |
London Paddington |
72.9m |
3 |
|
3 |
London Waterloo |
71.6m |
2 |
|
4 |
Tottenham Court Road |
67.2m |
4 |
|
5 |
London Bridge |
57.0m |
5 |
|
6 |
Farringdon |
55.3m |
8 |
|
7 |
Stratford (London) |
54.5m |
7 |
|
8 |
London Victoria |
53.9m |
6 |
|
9 |
Bond Street |
46.2m |
9 |
|
10 |
London Euston |
42.2m |
10 |
The top 10 most used stations outside London
| Rank | Station | Entries and exits | Rank last year |
|---|---|---|---|
|
1 |
Birmingham New Street |
38.8m |
1 |
|
2 |
Leeds |
28.0m |
3 |
|
3 |
Manchester Piccadilly |
26.6m |
2 |
|
4 |
Glasgow Central |
25.1m |
4 |
|
5 |
Edinburgh Waverley |
23.9m |
5 |
|
6 |
Gatwick Airport |
21.1m |
6 |
|
7 |
Liverpool Central |
16.2m |
9 |
|
8 |
Liverpool Lime Street |
15.8m |
10 |
|
9 |
Brighton |
15.8m |
7 |
|
10 |
Glasgow Queen Street |
15.4m |
8 |
The five least used stations in Great Britain
| Rank | Station | Entries and exits |
|---|---|---|
|
1 |
Reddish South, Greater Manchester |
94 |
|
2 |
Denton, Greater Manchester |
100 |
|
3 |
Elton and Orston, Nottinghamshire |
102 |
|
4 |
Chapelton, Devon |
148 |
|
5 |
Shippea Hill, Cambridgeshire |
154 |
Notes to Editors
- ORR’s Estimates of station usage April 2025 to March 2026 is available alongside data tables, quality and methodology reports and an interactive dashboard.
- Estimates of station usage statistics are primarily derived from LENNON, the rail industry’s ticketing and revenue system, together with some local ticketing data. Adjustments are made to produce estimates of station entries, exits and interchanges.
- The figures are estimates of station entries and exits, rather than counts of individual passengers.
- Methodology improvements, including the inclusion of ticket sales previously unavailable and better allocation of journeys to specific stations, mean that estimates are not always directly comparable over time.
- The Office of Rail and Road is the primary producer of official statistics for rail in Great Britain.