NASA Night-light Imagery Tracks US Energy Transition, Global Volatility
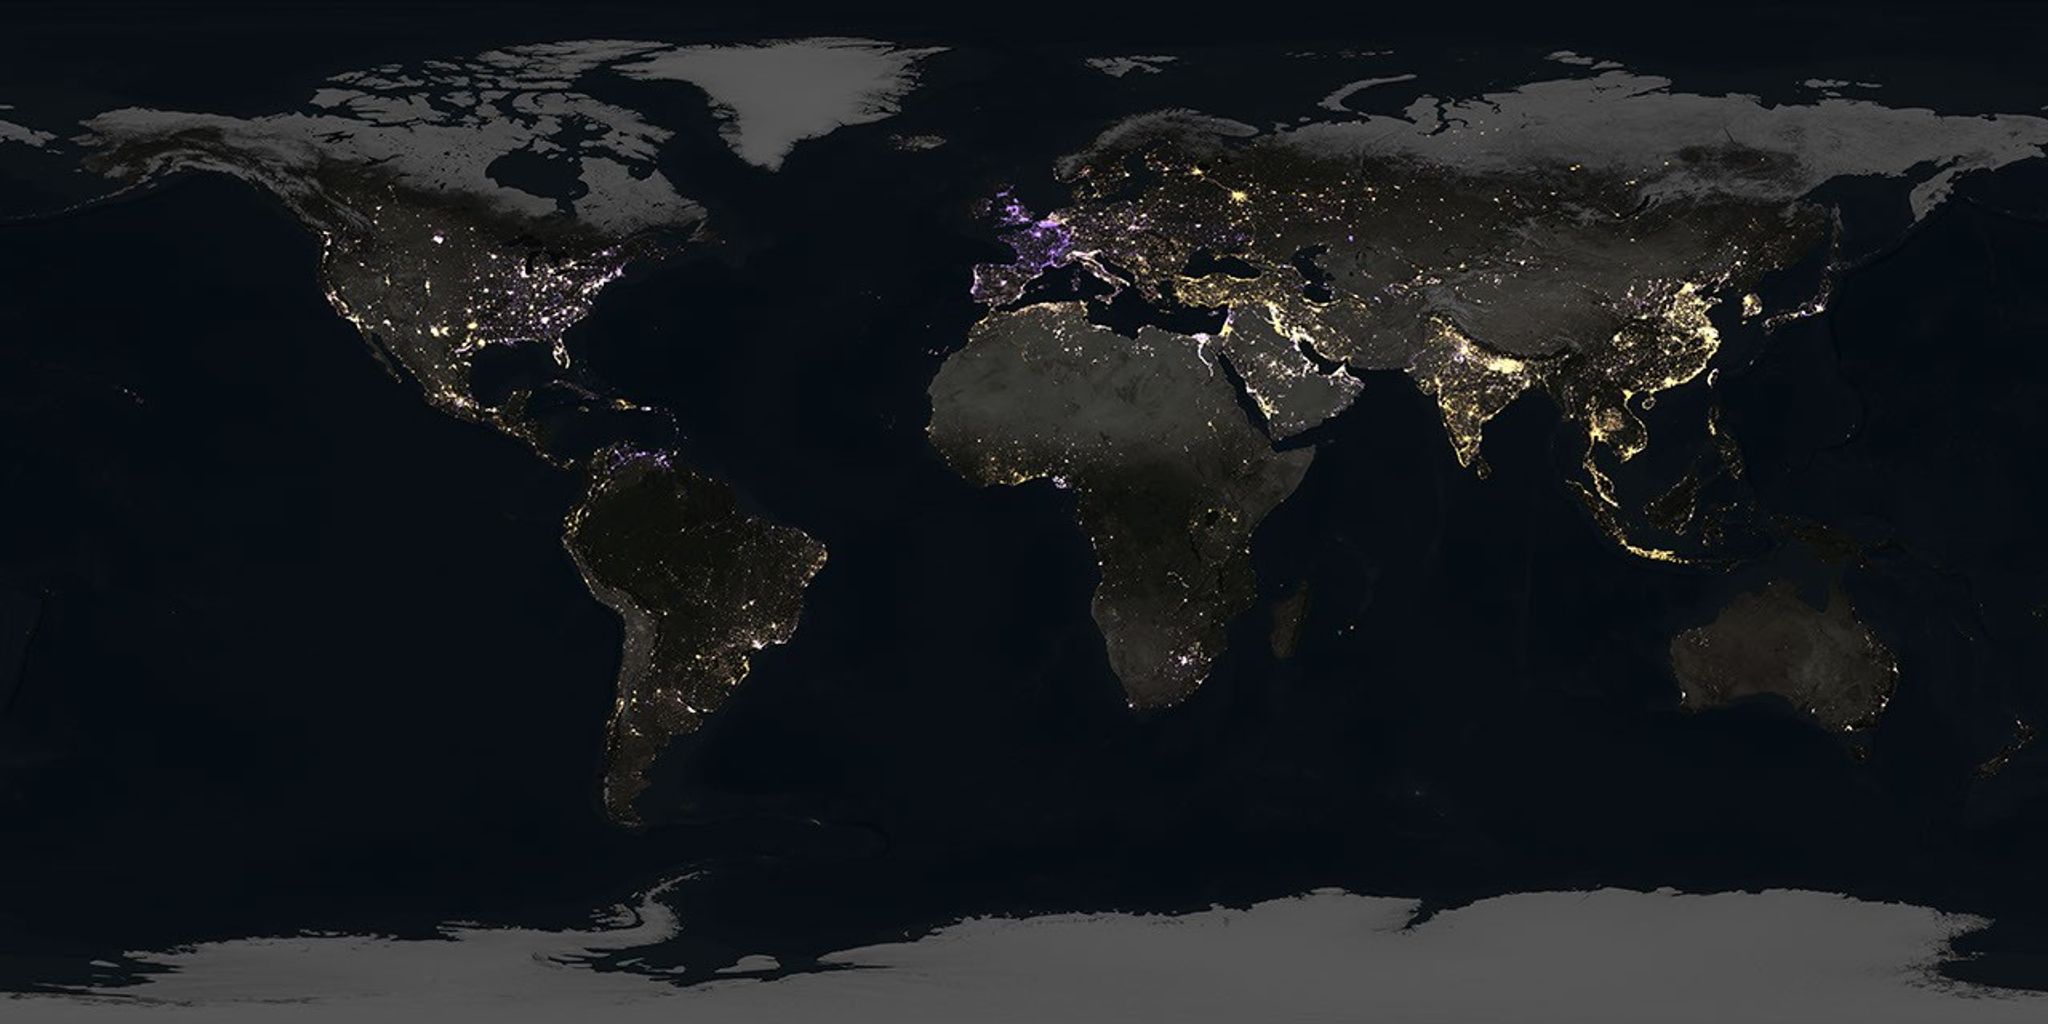
Kel Elkins/NASA’s Scientific Visualization Studio
New nighttime maps based on NASA satellite imagery are upending assumptions, revealing a world where artificial brightening and dimming have intensified over the past decade. The findings show intense flaring over major oil and gas fields in the United States, while factors such as rural electrification and energy conservation are changing how billions around the world experience the night.
“Unlocking energy sector insights is just one way NASA data is advancing national security interests at a critical time,” said Miguel Román, deputy director for atmospheres and data systems at NASA’s Goddard Space Flight Center in Greenbelt, Maryland. “Earth at night has so much to teach us.”
The study team, led by Tian Li and Zhe Zhu at the University of Connecticut, used a new algorithm to analyze 1.16 million satellite images collected at approximately 1:30 a.m. local time every day for nine years by the Visible Infrared Imaging Radiometer Suite (VIIRS). The refrigerator-size sensors, orbiting Earth at over 16,000 mph, can resolve light sources down to the scale of a toll booth on a dark highway. They fly aboard Earth science satellites that were launched and operated by NASA and the National Oceanic and Atmospheric Administration (NOAA).
The analysis, reported April 8 in Nature, covered most of the inhabited world, from latitudes between 60 degrees south and 70 degrees north. During the time frame analyzed—2014 to 2022—domestic production of oil and natural gas reached record levels, driven by technological developments and horizontal drilling. Satellite imagery revealed cycles of intense gas flaring over central U.S. regions, particularly the Permian Basin in Texas and North Dakota’s Bakken Formation. Flaring occurs at oil wellheads when excess gas—mostly methane—is burned off. The process releases carbon dioxide and soot, among other byproducts.
Flared gas is money burned, said Deborah Gordon, a methane expert at the non-profit Rocky Mountain Institute (RMI) who was not involved in the study. “Letting operators, investors, and insurers know that this is happening is a huge value proposition, both privately and publicly to the world. And it all starts with taxpayer dollars and NASA.”
Scientists, such as Gordon, and analysts across industries, use NASA night-light data to understand how energy moves through grids, pipelines, and supply chains in near real time. The data is free to access via the agency’s Black Marble product suite.
“Understanding where gas is being wasted around the globe and to have this data be public is huge for energy, and economic and environmental security,” Gordon said. “The Black Marble product provides free, openly validated flaring data that are critical inputs into RMI’s suite of public tools.”
City of Light saves energy, global shocks revealed
The latest nighttime maps also challenge some long-held assumptions.
Instead of a planet that simply glows brighter over time due to development—the prevailing view among researchers for decades—the new analysis portrays a world flickering with industrial booms and busts, construction, and blackouts, as well as more gradual shifts, such as policy-driven retrofits.
The study team was able to detect changes in night lights continuously, pixel by pixel, using methods that filter out interference from moonlight, clouds, and atmospheric effects. Their approach acts like giving satellites “smart glasses,” allowing them to focus on real changes.
Overall, the researchers found that global radiance increased by 34% during the study period, but that surge masks large areas of dimming. Such “bidirectional changes” often happen side by side. In the U.S., for example, West Coast cities grew brighter as their populations increased, while much of the East Coast showed dimming, which the team attributed to the use of energy-efficient LEDs and broader economic restructuring.
The authors concluded that internationally, nighttime light surged in China and northern India along with urban development, while LEDs and energy conservation measures coincided with reduced light pollution in Paris and throughout France (a 33% dimming), the UK (22% dimming), and the Netherlands (21% dimming). European nights dimmed sharply in 2022 during a regional energy crisis that followed the outbreak of the Russia-Ukraine conflict.
Tracking such dips and flares night after night “is like watching the heartbeat of the planet,” said coauthor Zhe Zhu, director of the Global Environmental Remote Sensing Laboratory at the University of Connecticut.
Flying since 2011, VIIRS sensors now are carried aboard three satellite platforms: Suomi NPP, NOAA-20, and NOAA-21. The instruments can sense light spanning visible to thermal infrared wavelengths. Their unique day-night band is ultrasensitive in low-light conditions, achieving finer resolution compared to previous night-light imagery provided by the Defense Meteorological Satellite Program.
By Sally Younger
NASA’s Earth Science News Team